The Retention Report's install count does not include duplicate installs based on Airbridge Device ID.
If 2 app installs occur with the same Airbridge Device ID on the same date, the retention metric is measured only for the last app install. If 2 app installs occur with the same Airbridge Device ID on different dates, the retention metric is measured for each install date.
The Actuals Report's install count does not exclude duplicate installs. Therefore, the install count in the Retention Report is smaller than that in the Actuals Report.
Airbridge Device ID
Airbridge Device ID is the UUID used to identify unique devices. By default, GAID (Android) and IDFV (iOS) are used as the Airbridge Device ID. In case GAID or IDFV could not be collected or is unavailable due to the restrictions of LAT or ATT, a UUID randomly generated by the Airbridge SDK is used as the Airbridge Device ID.
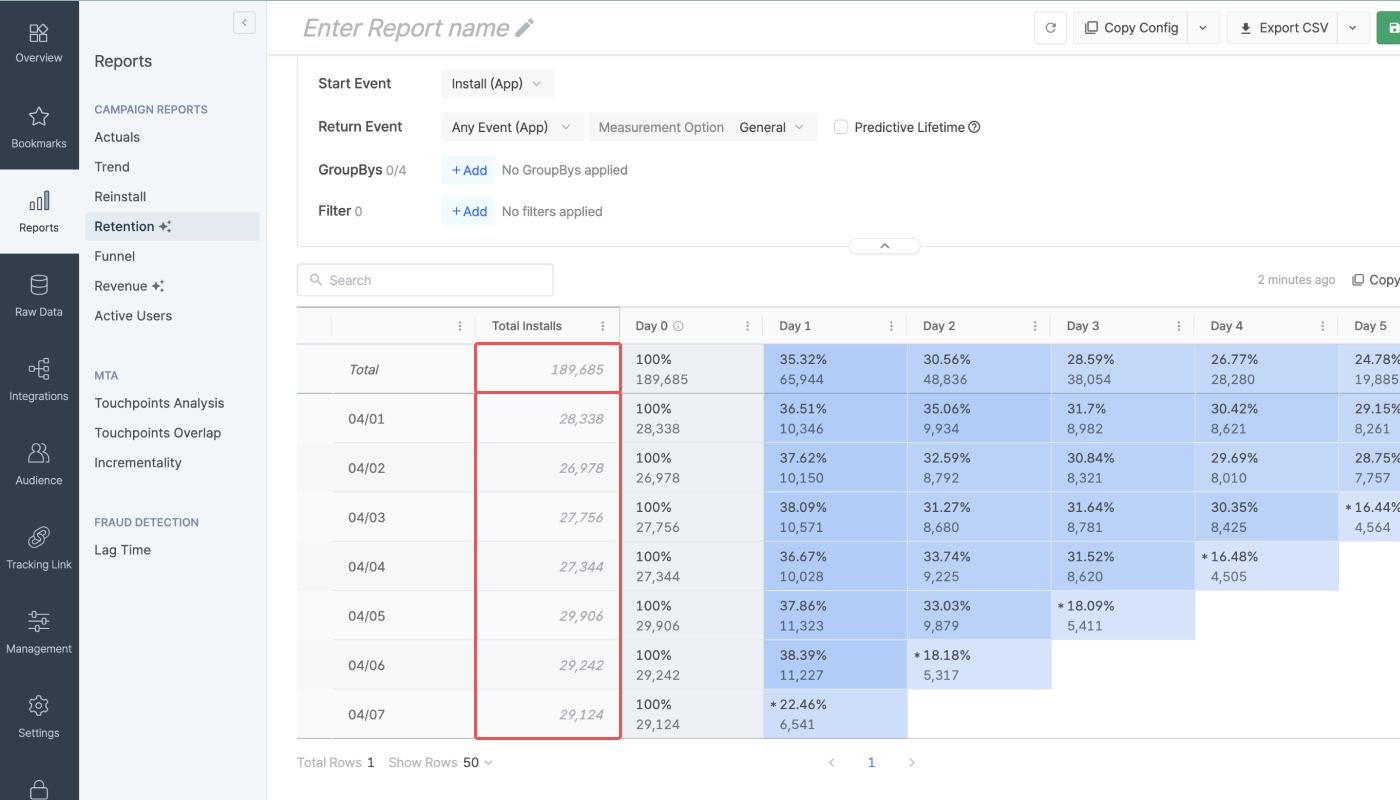
If the Return Events include all Start Events, the retention rate of Day 0, Week 0, Month 0, Hour 0, Minute 0 is displayed as 100%. This is because the Start Event is also considered as the Return event and counts the user who performed the Start Event as a returned user.
Refer to the example below.
Example
Let’s say 4 users performed the following events on 2024-04-01.
User A: Install (App), Subscribe (App)
User B: Deeplink Open (App), Subscribe (App)
User C: Add To Cart (App), Install (App)
User D: Add To Cart (App), Deeplink Open (App)
The Retention Report has been configured as follows.
Granularity and Date Range: Daily, From 2024-04-01 to 2024-04-05
Start Event: Install (App), Deeplink Open (App)
Return Event: Install (App), Deeplink Open (App), Sign-up (App), Order Complete (App)
The Install (App) and Deeplink Open (App) events are set as Start Event and also as Return Event. Because all users performed at least 1 of the 2 events, all users are considered to have performed a Start Event and also a Return Event. Therefore, the retention rate in Day 0 is displayed as 100.
The discrepancy is caused because the time periods for aggregating unique users differ.
The top row shows the unique users aggregated across the set date range. If a user performed multiple Start Events in different date buckets during the set date range, the number of retained user is counted as 1.
The sub-rows show the unique users for each date bucket only. If a user performed multiple Start Events in different date buckets during the set date range, that user is counted as a unique user for each date bucket. Therefore, the total number of retained users in the top row may be different than the sum of the number of retained users displayed in each sub-row.
Refer to the example below.
Example
A user performed the following events.
Installed the app after clicking a Channel Z's video ad and deleted the app on 2024-01-01.
Installed the app again after clicking a Channel Z's banner ad on 2024-01-02.
When the granularity is set to Daily, the Retention Report will show the following result.
Total number of retained users in the top row for Channel Z (From 2024-01-01 to 2024-01-02): 1
Number of retained users in the sub-row (2024-01-01) for Channel Z: 1
Number of retained users in the sub-row (2024-01-02) for Channel Z: 1
Unique Users
The number of unique users is different from the number of events that occurred. Even though an event occurred 10 times during the set date range, the number of unique users is counted as 1 if all 10 events were performed by a single user. For more details on the identifiers used for determining unique users by reports, refer to this article.
The Return Event is aggregated based on the date the event occurred.
Let’s say an app install event occurred at 10:00 PM, 2024-01-01. This user performed the app open event at 11:00 PM, 2024-01-01, and again at 2:00 PM, 2024-01-02.
When setting the Start Event to Install and the Return Event to Any Event, the Retention Report will report the Return Event to have occurred on Day 0 and Day 1.
The number of retained users is calculated by calendar dates. Refer to the example below.
Example
A user performed the following events.
Installed the app at 8:00 PM on 2024-01-01
Opened the app at 10:00 PM on 2024-01-01
Opened the app at 8:00 AM on 2024-01-02
The Retention Report has been configured as follows.
Start Event: Installs (App)
Return Event: Opens (App)
The Retention Report will show the following result.
The number of retained users in Day 0 (2024-01-01): 1
The number of retained users in Day 1 (2024-01-01): 1
The app open event performed at 8:00 AM, 2024-01-02 occurred 12 hours after the app install which is less than 24 hours. However, the calendar date has changed and therefore the user is counted as a user who returned to the app in Day 1.
The following conditions must be met to enable or view the predictive lifetime metric in the Retention Report.
The granularity must be set to Daily. The start date of the the date range must be set to at least 3 days earlier than today.
The number of users of a cohort must be at least 30. When the number of users of a cohort falls short, “Insufficient User Count” will show instead of the predictive lifetime.
The predictive lifetime value (pLTV) can be calculated by multiplying the predictive lifetime with the ARPDAU. In the Airbridge dashboard, the pLTV can be monitored using the Revenue Report. Refer to this article for more information.
Was this page helpful?